
To excel in trading, familiarize yourself with candlesticks and their implications. Each candle provides insights into price movements over a specified time frame. Pay attention to the body and wicks; a filled body indicates a bearish trend, while an empty body suggests bullish momentum.
Recognizing trends is fundamental. Ascending patterns signal growing interest and potential profit opportunities, while descending formations can indicate market corrections or bearish sentiment. Utilize moving averages to smooth out price fluctuations and identify these trends more clearly.
Technical analysis tools enhance your ability to interpret graphs effectively. Indicators like RSI (Relative Strength Index) and MACD (Moving Average Convergence Divergence) offer additional layers of insight, helping traders spot overbought or oversold conditions and potential reversal points. Understanding how to integrate these elements will elevate your trading strategy significantly.
Understanding Chart Types
Utilize line charts for a straightforward view of price movements over time. They effectively illustrate trends and make it easy to identify support and resistance levels. When analyzing these visuals, focus on the slope; a steep rise indicates strong buying interest, while a decline suggests selling pressure.
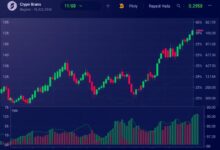
Candlestick charts provide more insight into market sentiment by displaying opening, closing, high, and low prices for specific intervals. Look for patterns such as engulfing or hammer formations; they can signal potential reversals. Pay attention to the color of the candles: green (or white) indicates upward movement, while red (or black) represents downward movement.
Bar charts serve a similar purpose to candlestick visuals but focus solely on price range within a timeframe. Each bar shows the open, high, low, and close prices. Recognizing the length of bars helps gauge volatility; longer bars indicate greater price movement.
Indicator overlays enhance your analysis by providing additional context about market conditions. Moving averages smooth out price data to highlight trends over specified periods. Use short-term moving averages to spot quick changes and long-term ones for broader trend assessment.
Fibonacci retracement levels can aid in identifying potential reversal zones based on historical price action. Plotting these lines on your graphs will help determine areas where traders may place buy or sell orders.
Select the appropriate chart type according to your trading strategy and timeframe. A combination of various types often yields deeper insights into market behavior, allowing you to make informed decisions based on technical analysis.
Key Indicators Explained
Focus on these specific indicators for insightful technical analysis:

- Moving Averages (MA): Averages of price over a specified period. Common types include Simple Moving Average (SMA) and Exponential Moving Average (EMA). Use them to identify trends and potential reversal points.
- Relative Strength Index (RSI): Measures speed and change of price movements. Ranges from 0 to 100, with values above 70 indicating overbought conditions and below 30 indicating oversold conditions.
- Bollinger Bands: Consist of a middle band (SMA) and two outer bands that represent volatility. Prices touching the upper band may indicate overbought conditions, while touching the lower band may suggest oversold conditions.
- Volume: Indicates the number of assets traded within a given timeframe. High volume can confirm trends or signal reversals, while low volume often suggests indecision.
- MACD (Moving Average Convergence Divergence): A trend-following momentum indicator showing the relationship between two moving averages. Use MACD crossovers for buy/sell signals.
Incorporate candlestick patterns alongside these indicators for enhanced decision-making:
- Doji: Signifies market indecision; further analysis is needed.
- Hammer: Potential bullish reversal when found at the bottom of a downtrend.
- Shooting Star: Indicates potential bearish reversal at market tops.
A combination of these indicators will provide a clearer picture of market trends and help in making informed trading decisions.
Price Trends Analysis
Focus on identifying upward and downward movements in asset prices. Recognize that trends can be classified as bullish (upward) or bearish (downward). Utilize candlesticks to visualize price action; each candle reflects open, close, high, and low prices over a specified timeframe. Observe patterns within these candles to anticipate potential market reversals or continuations.
Employ technical analysis tools such as moving averages to smooth out price data and identify the direction of the trend. The 50-day and 200-day moving averages are particularly effective for gauging long-term trends. A crossover of these two lines often signals significant market shifts.
Incorporate volume indicators alongside price movements. An increase in trading volume during an upward trend may indicate strong buyer interest, while rising volume in a downtrend can suggest increasing selling pressure. Look for divergences between price and volume to spot weakening trends.
Be wary of false breakouts; they can mislead traders into believing a new trend has begun. Confirm breakouts with additional indicators like the Relative Strength Index (RSI) or MACD to validate momentum shifts before making trading decisions.
Monitor support and resistance levels as they define key areas where price tends to reverse. A breakout above resistance could signify the start of a bullish trend, whereas a drop below support might indicate bearish sentiment.
Stay alert for chart patterns such as head and shoulders or double tops/bottoms, which often precede significant price movements. Understanding these formations enhances your ability to predict future trends effectively.
Using Volume Analysis
Monitor trading volume closely to gauge market strength. A surge in volume typically indicates heightened interest in a specific asset, often preceding significant price movements. For instance, if prices rise while volume increases, it suggests a bullish trend; conversely, rising prices with declining volume may signal weakness.
Incorporate volume indicators such as the On-Balance Volume (OBV) or Chaikin Money Flow (CMF) into your technical analysis toolkit. OBV aggregates volume based on price direction, helping identify potential reversals or continuations of trends. CMF measures the buying and selling pressure over time, providing insights into the strength behind price actions.
Compare current volume levels to historical averages for context. Anomalies in volume–either spikes or drops–can denote shifts in market sentiment. For example, a sudden increase after a period of low activity might indicate accumulation by savvy traders anticipating an upward trend.
Additionally, watch for divergences between price movement and volume. If prices are climbing but volume is decreasing, this discrepancy can foreshadow a reversal. Always consider broader market conditions when analyzing volumes; external factors like news events can significantly impact trading behavior.
In conclusion, effective use of volume analysis enhances your ability to interpret market dynamics and make informed trading decisions. Integrate these insights with other indicators to refine your strategy and adapt to changing market conditions.